| Сегодня 23 ноября, воскресенье |
|
|
|
Какой рейтинг вас больше интересует?
|
Nevron Chart for .NET 2015.12015-05-29 13:13:00 (читать в оригинале)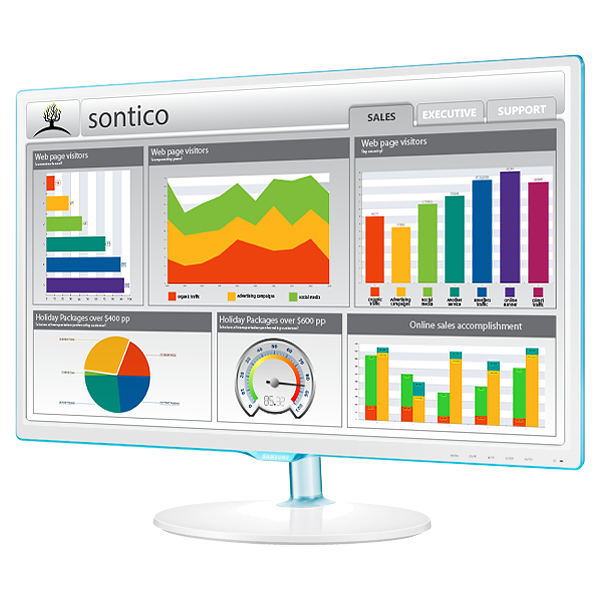 Nevron Chart for .NET 2015.1 Nevron Chart for .NET is the leading data visualization component for .NET. With it you will be able to display dynamic charts in minutes. In terms of flexibility, speed and presentation quality this component simply has no competition. The only chart for .NET which can display distinct looking charts with presentation "out of the box" quality, without sacrificing speed. Nevron Chart for .NET is powerful, flexible, extensible and user-friendly. It aims to provide your applications with data visualization capabilities, which will significantly improve the looks and penetration of your product. Nevron Chart for .NET is a unique component, since it combines the power of raster and vector graphics and employs state of art 2D and 3D rendering technologies. The component supports numerous charting types, VS design time support, empty data points, UI editors, data grid, build in toolbar, flexible axes, financial functions, HTML image maps, server side events, browser detection, custom client side scripts and more. Features Overview Common Features for the WinForm and WebForm editions: Charting Types: Bar; Line; Area; Pie; Point; Bubble; Stock; Floating Bar; Radar; Polar; High Low; Mesh Surface; Grid Surface; Shape; Smooth Line (Spline); Float bar (also called Gantt); Venn - 2, 3, 4, 5 etc. Venn set; Step Line; Error Bar. Flexible integrated legend Built in Functions and Formula support Full Visual Studio design time support Editors available at runtime Excel like fill effect editors Advanced control over the axis scaling and position Axis labeling abilities Ability to display several charting types simultaneously Ability to display several series simultaneously Ability to display multiple charts and legends in the component canvas Image borders Watermarks Labels Interactivity Drill Down capabilities Advanced 3D view control Advanced control over the scene lighting Integrated layout manager Measurement Unit support Annotation support Advanced logic features and services Modular design SVG support Editor direct update feature Nevron DOM Compatible AutoRefresh property Custom Binary and Custom XML serialization Rendering of chart walls Windows Forms specific features: Built in UI components Ability to leverage the video board hardware acceleration Print Manager Web Forms specific features: Server side events (postback) and HTML image maps Server side persistency Ability to inject custom client side script Ability to directly stream an image to the client browser Built-in temporary file clean up Built-in browser detection
|
Категория «Поэты»
Взлеты Топ 5
Падения Топ 5
Популярные за сутки
|
Загрузка...
BlogRider.ru не имеет отношения к публикуемым в записях блогов материалам. Все записи
взяты из открытых общедоступных источников и являются собственностью их авторов.
взяты из открытых общедоступных источников и являются собственностью их авторов.